
13 Apr FAERS
Posted at 12:33h
in
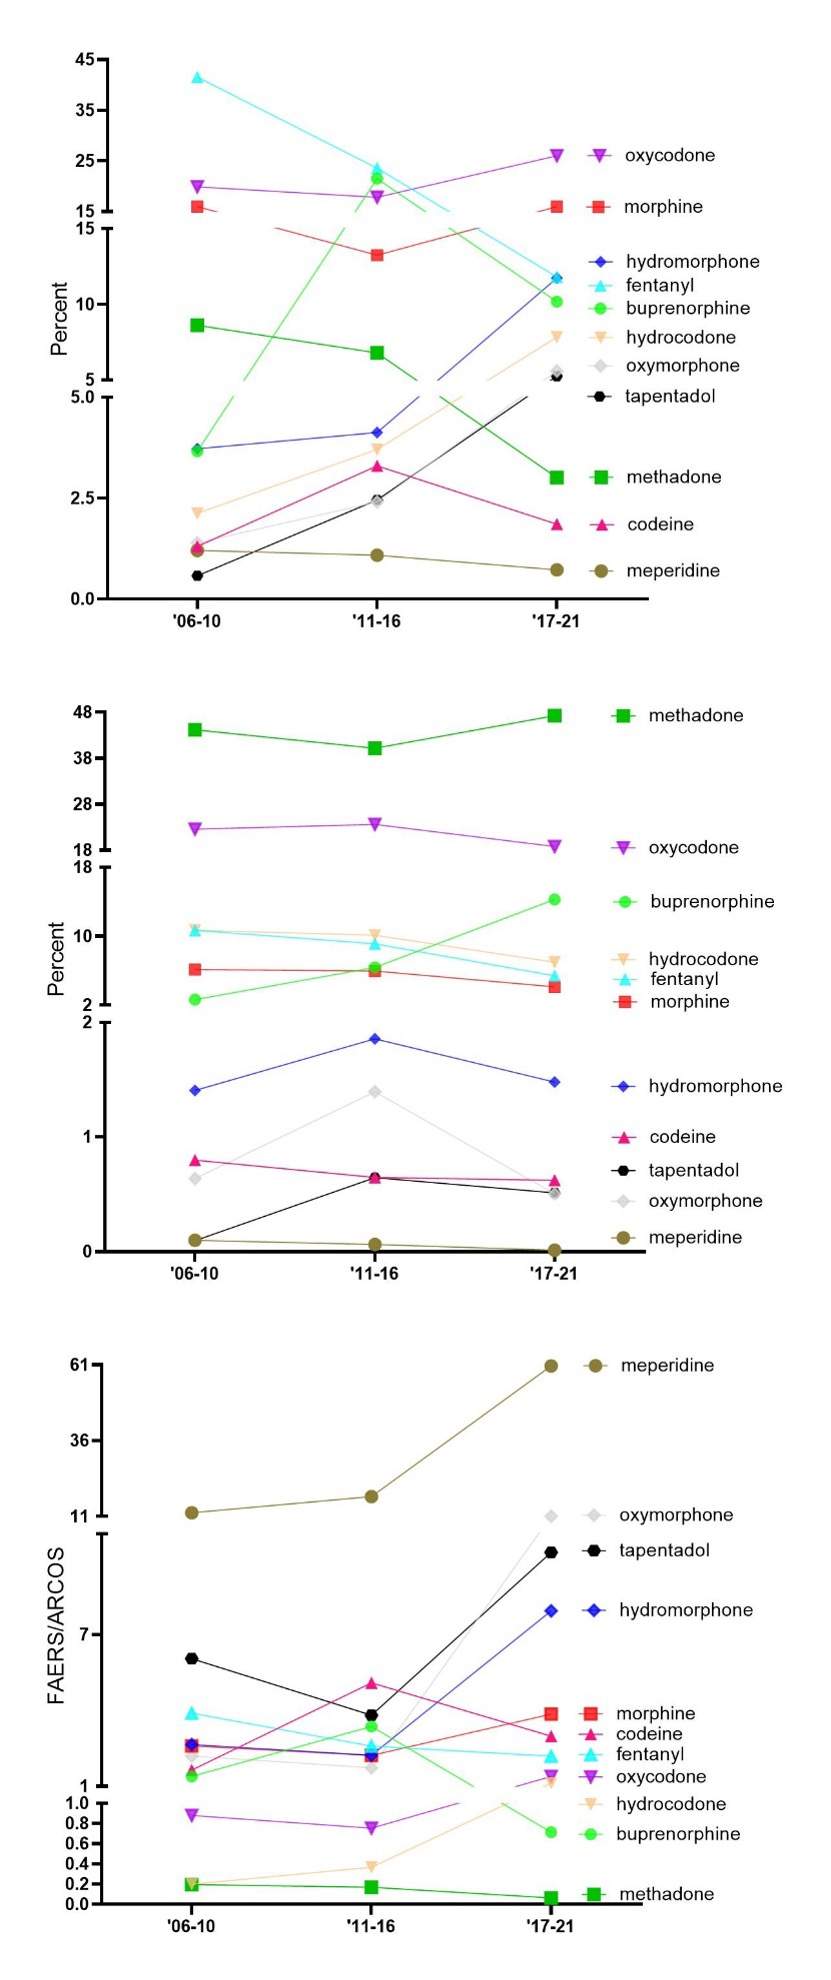
Figure. US Food and Drug Administration’s Adverse Event Report System (FAERS) prescription opioid adverse events from 2006 to 2021 (n = 667,969, top). Drug Enforcement Administration’s Automated Reports and Consolidated Ordering System (ARCOS) prescription opioid distribution in Morphine milligram equivalents (MME) (middle). Ratio of adverse event reports of select opioids as reported to FDA Adverse Event Reports (FAERs) relative to the percent distribution as obtained from Automated Reports and Consolidated Ordering System (ARCOS) (bottom). Ratios > 1 are overrepresented and < 1 are underrepresented.