
13 Mar CT images from COVID-19 2020
Posted at 18:50h
in
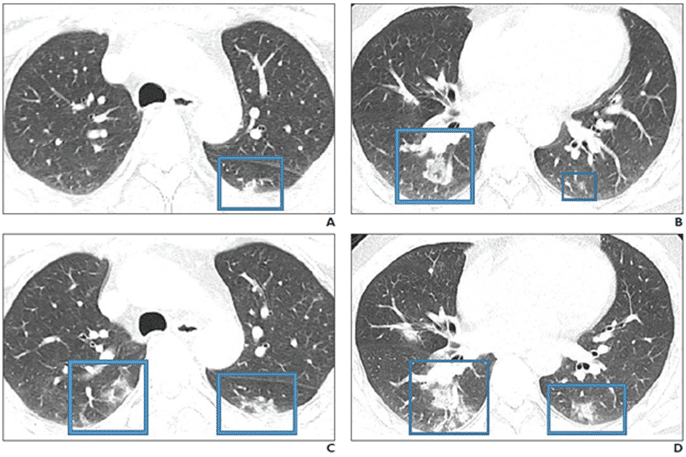
A and B, Initial CT images obtained show small round areas of mixed ground-glass opacity and consolidation (rectangles) at level of aortic arch (A) and ventricles (B) in right and left lower lobe posterior zones.
C and D, Follow-up CT images obtained 2 days later show progression of abnormalities (rectangles) at level of aortic arch (C) and ventricles (D), which now involve right upper and right and left lower lobe posterior zones.