
18 Mar Life expectancy crisis in the USA
Posted at 13:05h
in
CAPTION
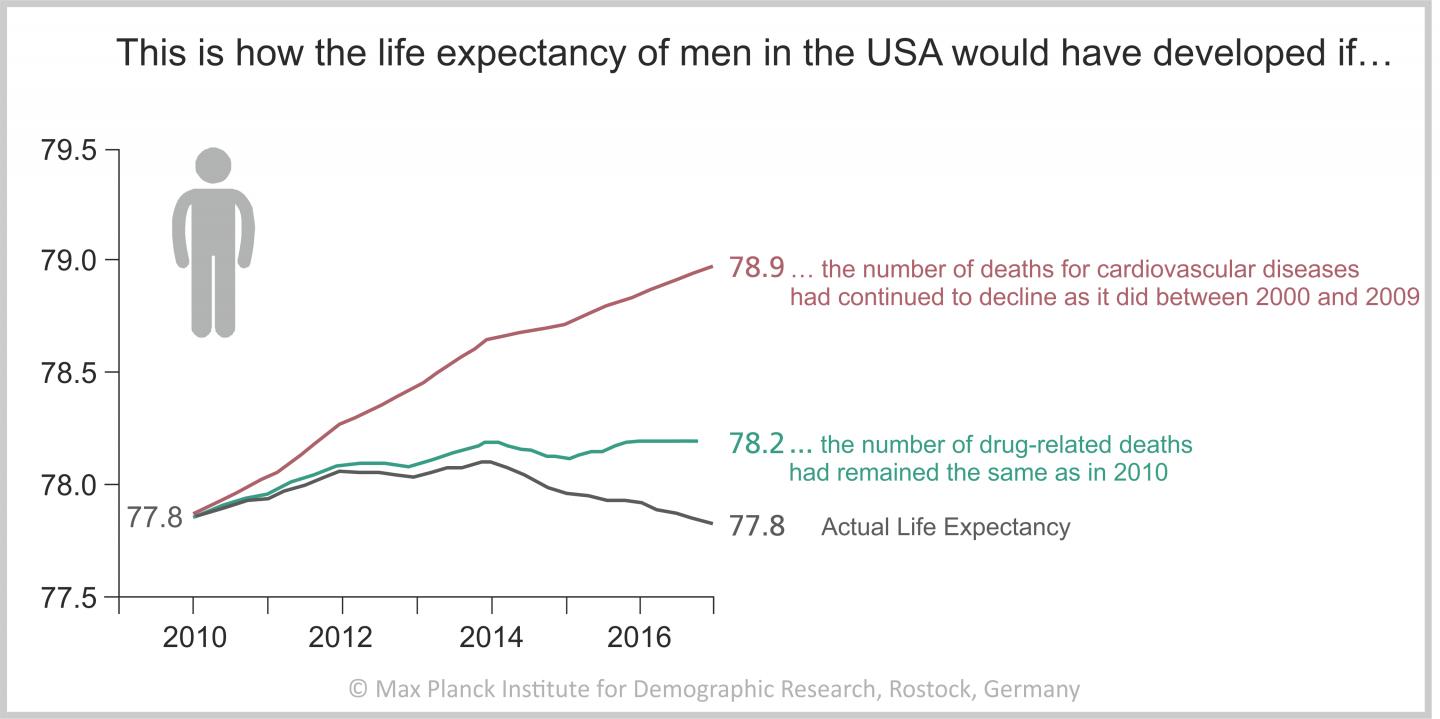
The figure displays the results of a simulation that examines the size of the influence of each of the two causes of death. The simulation shows how the life expectancy of 25-year-old American men would have developed between 2010 and 2017 if the number of drug-related deaths had remained constant, and how it would have developed if the number of deaths from cardiovascular diseases had declined to the same extent as it did between 2000 and 2009. (The simulation calculates the remaining life expectancy of 25-year-olds; in the figure, these 25 years are added to the total life expectancy.)
CREDIT: MPIDR